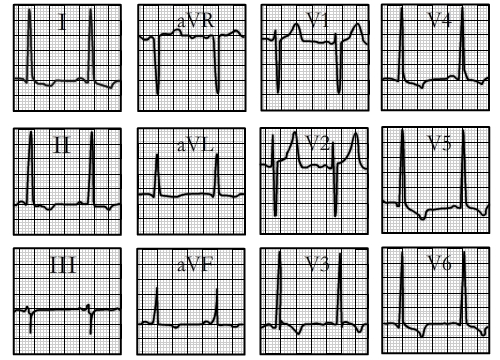
This electrocardiogram shows left ventricular hypertrophy. The characteristic features demonstrated here include:
Increased voltage, reflected by the S wave in V1 plus the R wave in V5
exceeding 35 mm.
Associated tall R waves
in leads I, aVL and V4 through V6; and
ST-T wave abnormalities, well seen in these same leads.