You are incorrect - the best interpretation of the electrocardiogram in our patient left ventricular hypertrophy.
Your choice: Left ventricular hypertrophy + left anterior fascicular block
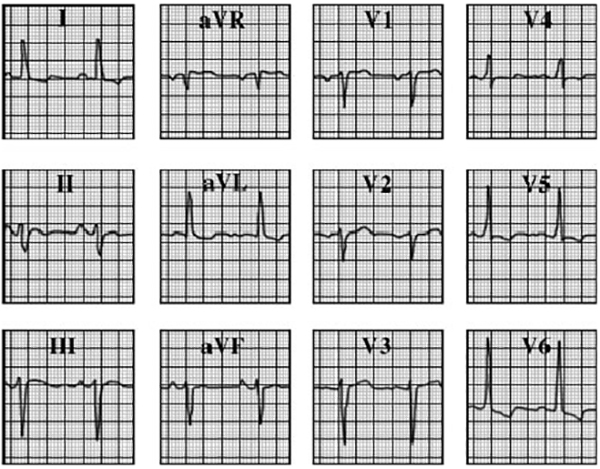
This electrocardiogram shows left ventricular hypertrophy and left anterior fascicular block.
The characteristic features of left ventricular hypertrophy demonstrated here include: Increased voltage, reflected by the tall R waves in aVL exceeding 11 mm. ST-T abnormalities well seen in this lead as well as in leads I, V5 and V6. A prolongation of the QRS interval and left atrial enlargement, reflected by the wide P wave in lead II and the prominent negative P wave in lead V1.
Left anterior fascicular block is manifested by left axis deviation of equal to or more than minus forty-five degrees and is reflected by the negative QRS in lead II with an rS morphology.