You are incorrect - our patient's electrocardiogram shows left ventricular hypertrophy + left atrial enlargement.
Your choice: Left Anterior Fascicular Block
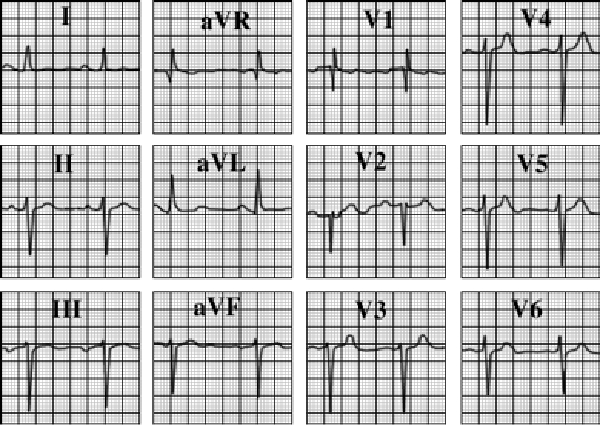
This electrocardiogram shows left anterior fascicular block. The characteristic features demonstrated here include left axis deviation with a rS morphology in lead II.
One common axis criterion is a deviation of ≥ -45°, as evidenced here by the negative QRS complex in lead II. Because of the marked left axis deviation, there is often delay in R wave progression across the precordium, as seen here.
Left anterior fascicular block may be seen in otherwise normal patients. When seen in association with electrocardiographic changes of anteroseptal ischemia and/or infarction, it likely represents left anterior descending coronary artery disease.