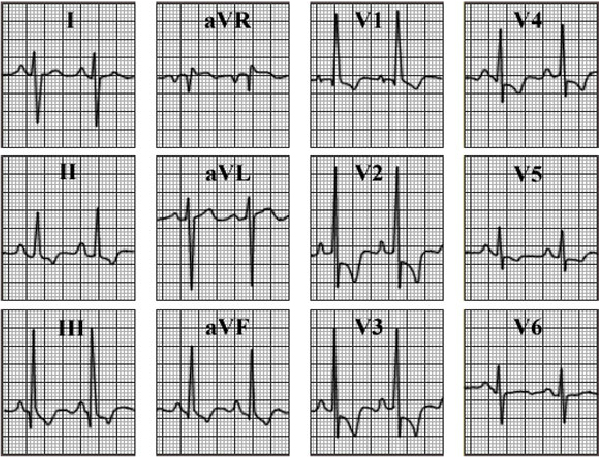
RV Hypertrophy and Right Axis Deviation
This electrocardiogram shows left ventricular hypertrophy and right axis deviation.
The features of right ventricular hypertrophy demonstrated here include:
A tall R wave in leads V1 to V3, associated with deep T wave inversion and ST segment depressions in the same leads; and right atrial enlargement demonstraed by tall P waves in lead II. Right axis deviation, also a feature of right ventricular hypertrophy, is demonstrated by the predominantly negative QRS complex in lead I.