You are incorrect - our patient's electrocardiogram demonstrates left ventricular hypertrophy.
Click on the links to learn about this ECG:
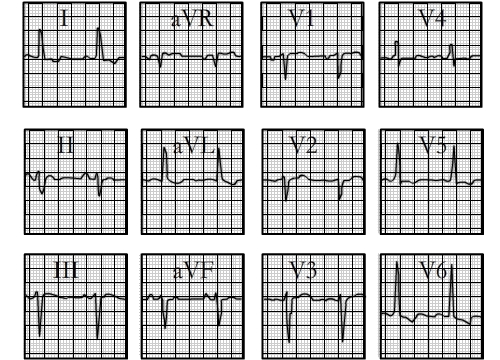
Your choice: Left ventricular hypertrophy + left ventricular fascicular block
This electrocardiogram shows left ventricular hypertrophy and left anterior fascicular block. The characteristic features of left ventricular hypertrophy demonstrated here include increased voltage, reflected by the tall R wave in aVL exceeding 11 mm, ST-T abnormalities well seen in this lead as well as leads I, aVL, V5 and V6, a prolongation of the QRS interval , and left atrial enlargement, reflected by the wide P wave in lead II and the prominent negative P wave in lead V1. Left anterior fascicular block is manifested by left axis deviation of ≥ -45° and is reflected by the negative QRS in lead II with an rS morphology in lead II.
One common axis criterion is a deviation of ≥ -45°, as evidenced here by the negative QRS complex in lead II. Because of the marked left axis deviation, there is often delay in R wave progression across the precordium, as seen here.
Left anterior fascicular block may be seen in otherwise normal patients. When seen in association with electrocardiographic changes of anteroseptal ischemia and/or infarction, it likely represents left anterior descending coronary artery disease.