You are incorrect - the best interpretation of the electrocardiogram in our patient is non-specific T wave abnormalities.
Your choice: Normal
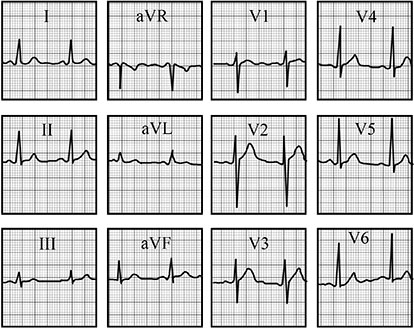
This electrocardiogram is within normal limits. The rate is 70 per minute and the rhythm is normal sinus. The frontal plane axis is within normal limits at +30°. The P wave that represents atrial depolarization, is normally upright in lead II. The QRS that represents ventricular depolarization is normal with no pathologic Q wave, evidence of hypertrophy or intraventricular conduction delay. ST segments are normally concave without elevation or depression. T waves that represent ventricular repolarization are also normal. They are positive in leads I, II and V2 through V6 with a more gradual upstroke than downstroke.