You are incorrect - the best interpretation of the electrocardiogram in our patient is non-specific T wave abnormalities.
Your choice: Hypokalemia
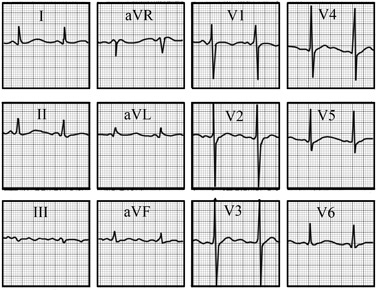
This electrocardiogram shows changes consistent with hypokalemia. The characteristic features demonstrated here are the somewhat flattened T waves that are merging with prominent U waves, thereby simulating a prolonged QT interval. This is best seen in leads V2 and V3.